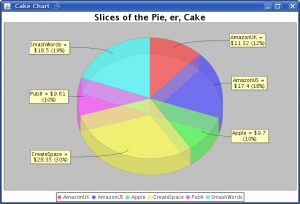
I’ve spent time this week developing different subsystems of the MagicBakeshop software. The most visually interesting is the data charting capability, here’s an example (don’t get hung up on the color choice, that can change):
The data selection is much improved, and the scrollbar problem on the main window is fixed.
Those of you with many titles or a lot of sales reports will be happy to know that I’ve sped up the data import: on my 1 GHz system it will load 1000 records in about 1/6th of a second. Got a million records? Less than a minute. Of course you can’t actually display a million records in the panel (unless you’ve got a lot more RAM than I do), so the view will limit itself to a couple of thousand records. Queries on the data, though, will work on the full million. Or more; there’s no set upper limit.
My task now is to integrate the disparate pieces back into the main program and package it up for you to play with. That should be done this weekend, stay tuned.
Got any other features you’d like to see or particular data queries you need to run? Let me know.
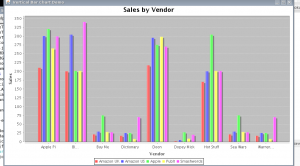
Edit to add: Another example of the kind of charts the graphing package is capable of.


